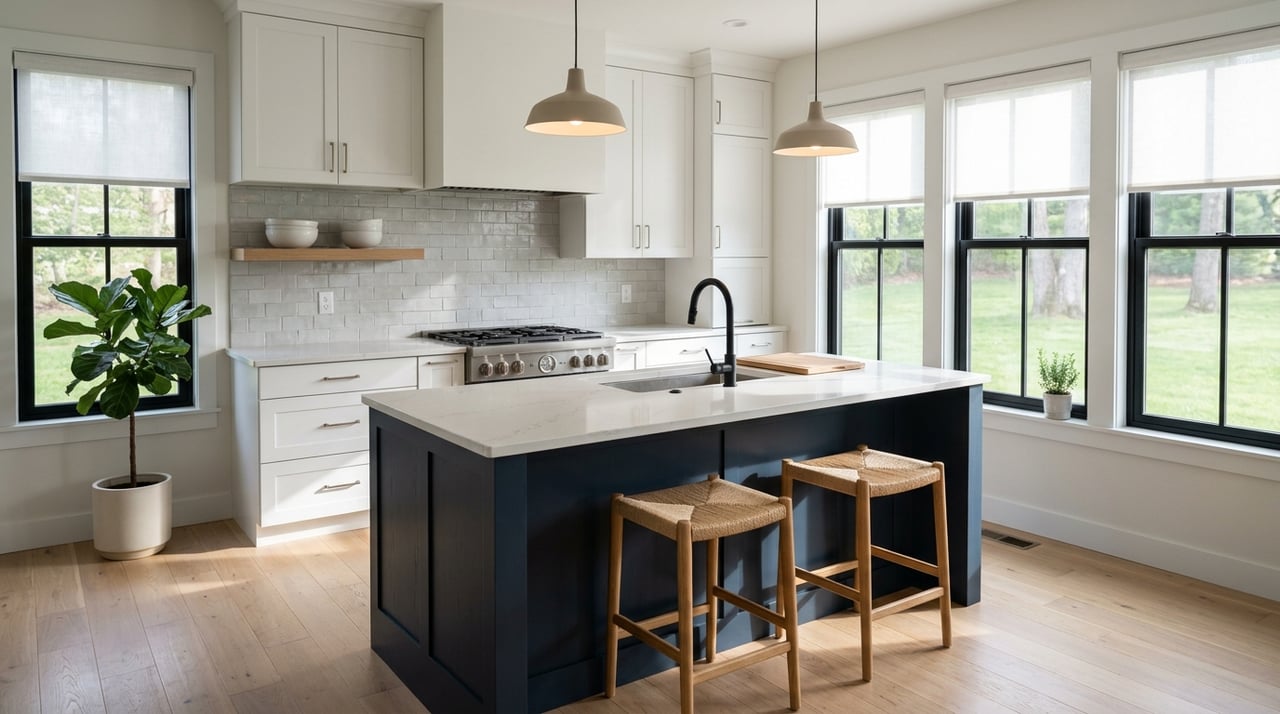
Understanding Hunterdon County Real Estate Market Trends
June 4, 2026
June 4, 2026
If the Hunterdon County housing market feels a little hard to read, you are not imagining it. One report says inventory is tight, another shows a different listing count, and price headlines can seem all over the map. The good news is that the market makes a lot more sense once you know which numbers to focus on and how to apply them to your own plans. Whether you are buying or selling, this guide will help you understand what the latest data really suggest and what it may mean for your next move. Let’s dive in.
Hunterdon County remains a relatively tight market, especially in certain property types. According to the New Jersey REALTORS® local market update current as of May 9, 2026, single-family homes had 276 active listings, 3.2 months of supply, 38 average days on market, and a median sales price of $627,500 through April 2026.
That same report shows townhouse-condos with 34 active listings, 1.4 months of supply, 39 average days on market, and a median sales price of $379,000. Adult community homes were even more limited, with 4 active listings, 1.4 months of supply, 49 average days on market, and a median sales price of $597,500.
A balanced market is often considered closer to 4 to 5 months of supply. By that measure, Hunterdon County is still running below balanced in single-family homes, while townhomes, condos, and adult community homes appear even tighter.
One of the biggest sources of confusion is that public housing reports do not all measure the same thing. For example, the county MLS snapshot shows 276 active single-family listings, while Zillow shows 319 for-sale listings and Realtor.com shows 662 active homes.
Those numbers are not necessarily wrong. They are just based on different scopes, filters, and definitions. That means you should treat them as directional, not interchangeable.
Timing metrics also vary from one source to another. NJ REALTORS® reports average days on market until sale, Zillow reports days to pending, Redfin reports median days on market, and Realtor.com reports median days on market for listings.
That is why you may see one source say 17 days, another say 24, another say 32, and another say 38. These figures are related, but they are not measuring the same point in the process.
If you are trying to pin down the “typical” Hunterdon County home price, the best answer is that it depends on which metric you are looking at. Current county-wide signals cluster in the low- to mid-$600,000s for a typical home.
Redfin reports a median sale price of $543,482. Zillow reports a typical home value of $631,405. Realtor.com reports a median listing price of $674,900, while the county MLS update places the single-family median sales price at $627,500 through April 2026.
These numbers can all be useful, but they are not interchangeable. Sale price, listing price, and estimated home value each tell you something different.
County averages are helpful for general orientation, but they do not tell the whole story in Hunterdon County. Prices can vary meaningfully from one township to another.
In the March 2026 county report, single-family median prices ranged from $425,000 in Union Township to $835,000 in Readington Township and $849,500 in Tewksbury Township. Tewksbury’s year-to-date median was just over $1.0 million.
That kind of spread is important if you are making an offer or setting a list price. A county median can provide context, but township-level comparable sales are much more useful when you need a realistic strategy.
Hunterdon County’s housing stock appears relatively stable, which may help explain why inventory often feels limited. Census Bureau data show that 85.1% of housing units are owner-occupied and 91.2% of residents lived in the same house one year ago.
When a large share of residents stay put, fewer homes may come to market at any given time. Even if new listings rise, inventory can still feel constrained because there is not a large amount of turnover.
For buyers, that can mean fewer choices. For sellers, it can create opportunity, but only if pricing and preparation line up with current demand.
Well-priced homes are still attracting strong attention in Hunterdon County. The county MLS report shows single-family homes receiving 101.8% of list price on average through April 2026.
At the same time, not every home is selling in a bidding war. Zillow reports that 36.8% of sales closed under list price, which is a helpful reminder that condition, presentation, pricing, and location still matter.
If you are buying, preparation matters just as much as speed. It helps to get pre-approved, set a firm budget ceiling before you start touring, and be ready to act quickly when a home is priced well and fits your needs.
Just as important, you should avoid assuming every listing will go far over asking. Some homes draw intense competition, while others create room for negotiation. The right strategy depends on the specific property and the most relevant local comparable sales.
For sellers, Hunterdon County data point to a market that still rewards realistic pricing. Single-family homes averaged 38 days on market with 276 active listings in the latest county snapshot, so overpricing can reduce early momentum.
That early window matters. Buyers tend to watch new listings closely, and homes that enter the market at the wrong price can become easier to overlook as newer options appear.
Supply is tighter in the townhouse-condo and adult community segments, but those categories have smaller sample sizes. That means month-to-month swings can look more dramatic than they really are.
The county report itself notes that percent changes can appear extreme when sample sizes are small. That is especially important to remember when looking at adult community data, where just a few homes can shift the numbers sharply.
The best way to use county-wide market data is as a starting point. It gives you a sense of overall direction, including whether inventory is tight, how quickly homes are moving, and where broad pricing trends sit.
What county data cannot do is price a specific home or tell you exactly how aggressive your offer should be. In Hunterdon County, the right strategy depends heavily on township, property type, condition, acreage, and current competition.
If you are buying, that means comparing the home you want against recent sales in the same local area. If you are selling, it means building a pricing plan around true comparables rather than relying on county averages alone.
The Hunterdon County housing market is not one single story. Single-family homes are tighter than a balanced market, but they are closer to balanced than townhomes, condos, or adult community homes. Prices remain strong overall, yet local variation is significant.
That is why broad headlines only get you so far. To make a smart move, you need the county view and the township view working together.
If you want clear guidance on what the numbers mean for your next purchase or sale in Hunterdon County, Beverly Yoson can help you sort through the data, understand your options, and move forward with confidence.
Stay up to date on the latest real estate trends.
Experience a real estate partnership built on trust, expertise, and genuine care. Beverly brings a lifelong understanding of what “home” truly means to every client and every decision.